Baroduino - Barograph with Arduino and 2,2" TFT screen [150425]

Searching the net I did not come across mainy projects resulting in a barograph where the 48 h evolution of the atmospheric pressure was displayed on a screen. Being a sailor it is important to monitor this evolution to an extend that a more than 140 Pa/h pressure drop is the indication of upcoming very strong winds.
This project has been published in the September 2016 edition of Elektor Magazine.
Given this I decided to make a barograph showing the pressure evolution over 48h as well as a visual (flashing LED) and a sonic ( buzzer) alarm if the atmospheric pressure drops more than 140Pa/h.
In order to be very flexible with the power source I added a stable 5V power supply based on the LM2574 so that every DC power source between 5V and 40V is accepted. This is optional since if only used on a boat with 12V one could directly feed the Arduino RAW pin. My boat is 24 V and at home I plug in a 9V supply. A more compact alternative would be the Adafruit step down module LM2596S at 3,95€.
The total hardware apart from the power supply consists of 3 major components. The Arduino pro mini 5V, the Sparkfun sensor BMP180 breakout board and the Adafruit 2,2" TFT screen with SD card holder.
A micro SD card of 2GB is enough. This is necessary since all measurement are written to the SD card and they are read from this card to perform calculations or display historic evolutions. On top you need a piezo buzzer , a switch to shut off the alarm and a red LED with resistance but of course only if you want to incorporate the alarm functionality.
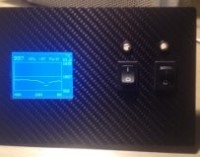
The sensor BMP180 also measures the temperature which I also display on the screen although not so relevant since depending on where the barograph is installed. I join a picture of the finished project as well as how to connect the different components.
Of course the sketch to load in the Arduino is also available.
Discussion (10 comments)
scud 4 years ago
I'm also interested in your new software version should it be still available
email scudecla@gmail.com
Thamks in advance
Sven Bäuerle 4 years ago
With some tinkling I managed to make baroduino run on an esp32 dev board with a TFT Display. Looks nice.
Somebody interested in code and pictures ?
Have a nice day
Sven
p_michele 4 years ago
Ich bin sehr an Deinem Code und der Beschreibung interessiert.
Bitte email an pemico1955@t-online.de
Sven Bäuerle 4 years ago
pinconnection and pictures
TFT_2.4_320x240_TFT_eSPI.pdf (25kb)
Holger 4 years ago
DAnke.
Holger
Sven Bäuerle 4 years ago
search for https://github.com/svenakis/barograph_esp32_bme280_TFT_eSPI
I don't have pictures yet, comming soon
esp32_TFT_eSPI_barograph.pdf (322kb)
Vlado Stojanov 4 years ago
Sven Bäuerle 4 years ago
search for https://github.com/svenakis/barograph_esp32_bme280_TFT_eSPI
I don't have pictures yet, comming soon
esp32_TFT_eSPI_barograph.pdf (322kb)
Vlado Stojanov 4 years ago
NickT 7 years ago
cheers, Nick
NickT 7 years ago
Well worth installing just to see what the pressure does. Th reading that I have done suggests that I should see some global effects, but to do that, a real time clock would be useful, even so, there was a disturbance visible when the earthquake hit Turkey a few days ago - not sure if that ws what I was seeing though.
NickT 7 years ago
My device is in a sealed case with a "port" to allow the pressure to equaiize so in theory, I could fit a "mechanical reference" and filter, but that's done in the software. If I reduce the taps I guess that I'll see very short local events but should also see global events like earthquakes ...
I need to do more reading !!
NickT 7 years ago
schorty 7 years ago
cheers
Werner
NickT 7 years ago
NickT 7 years ago
NickT 7 years ago
schorty 7 years ago
Put the new file in a separate subdir having the same name as the file!
Werner
NickT 7 years ago
N
NickT 7 years ago
Adafruit_ILI9340 tft = Adafruit_ILI9340( _cs, _dc, _rst);reporting: redefinition of 'Adafruit_ILI9340 tft'
can't see why at the moment but will experiment furthe
Nick
NickT 7 years ago
schorty 7 years ago
Hi Nick,
Here is the new version including autoscaling...
If the range is small it can be selected either to set the scale to relative or absolute values by changing
#define DIFFERENCE_SCALE 1 // select either difference scale or absolute scale + extra digit below SCALE_SWITCH_THRESHOLD
If you find bugs or you have proposals for improvement please let me know....
cheers
Werner
NickT 7 years ago
Nick
schorty 7 years ago
I will implement an autoscaling function to optimize the visibility of small changes.
cheers
Werner
NickT 7 years ago
Interesting to build another but to let the centre line line float and reduce the range so that small changes were visible. The sensor looks sensitive enough to show some very small changes.
nick
schorty 7 years ago
Yes - ports 2 and 3 are correct (as defined in the program).
However as the internal pullups are very weak (they ARE enabled in the program though) it might be necessary either to connect external pullups or - what also helps - to place two 100nF capacitors between ground and the push buttons ports.
cheers
Werner
schorty 8 years ago
I built up the circuit using an arduinio uno and an ebay ILI9340 display (incl. SD).
My main problem was that the SD-reader could not be initialized. It turned out that the chip select for sd had to be set high BEFORE set to an output pin (otherwise the initialisation of the sd card failed).
Amongst some code optimisations I modified the software to come up with the following additional features:
- user selectable displayed history length via two push buttons (1h - 16 days)
- rolling average for calculating the pressure in order to minimze "value jumps"
- calculation of relative pressure based on user definable altitude
- simultanuous display of relative and absolute pressure
- simultanuous display of 1hour trend and 3 hour trend
- many user definable variables for easy change of settings (e.g. alitude, min/max pressure, measurement repetition time, chart refresh repetition time, storage repetition time, logfilename, chart position .....)
If someone is interested in this software version please leave a message in this thread....
cheers
Werner
scud 4 years ago
I'm very interested in your software version if it is still available.
In case my email is
scudecla@gmail.com
Thanks in advance
Regards
Scud
Robert Schwarz 7 years ago
thanks for your reply, I have to check out your autoscaling, since I added buttons to adjust the pressure range and had to use a MEGA anyway fo have enough pins.
Finished a prototype.
Here is a link to the project (and some others)
http://www.antarctic-adventures.de/projects.html
cheers, Robert
PS: don't know why it won't let me post without youtube or vimeo address, so I put one of my videos there in even it is not related to the barograph, but still worthwhile watching ;)
barograph.jpg (264kb)
https://vimeo.com/221850260
schorty 7 years ago
A new version having autoscaling is posted for download (see thread "my_barograph")
werner
schorty 7 years ago
The program fits into the arduino memory using the Adafruit GFX / ILI9340 library.
I tried to optimize the code but nearly all the memory of the UNIO is needed.
However as only VERY little space is left a larger graphics library might be too large for an UNO board.
However if only a few bytes more are need reducing the number of rolling average taps might help.
cheers Werner
Robert Schwarz 7 years ago
ok I managed to get it running after many hours, but only on a MEGA board, on an UNO (ATmega328) I tried the original code and Werner's but it tells me it's to big and it won't compile, the graphic libraries I'm using don't seem to be bigger than the original ones, so I don't know why it's not working with the UNO, any comments? Somebody has the same problem?
But thanks for the code and the neat project :)
cheers, Robert
Robert Schwarz 7 years ago
I got a different display (http://www.instructables.com/id/UNO-R3-28-TFT-Touch-Screen-With-SD-Card-Socket-for/) the mucfriend drivers work or I got the dispaly running with Adafruit_TFTLCD. I tried to alter the code for my display but doesn't work. Anybody tried the barograph with some different displays?
I'm stuck with what I got from the hardware side, since I'm in Antarctica on a research station and we isolated until November.
Thanks for any help or suggestions :)
cheers, Robert
TREINROVER 8 years ago
schorty 8 years ago
sorry for my late reply but I actually forgot about my post.
Here is the .ino file of my version for the elektor barometer.
Anyway, I would be glad to receive some feedback (bugs, hints, suggestions etc.)
If you have questions please post them here.
cheers
Werner
TREINROVER 8 years ago
i have build the baroduino also with a ili9340 with sd card from ebay. Everything is showed nicely but the graph after 48 h is not visibile, The file "tekst15" exist and is filed with data who looks ok. this all makes that i am also interested in the mofications you made... Can you please share them with me.
Thanks a lot!!!
Daniel Sirlonge 8 years ago
Bonjour Werner
Je suis tres interesse par le nonveau Code
Pourquoi ne pas le mettre en piéce jointe dans l'article ci-dessus.
Merci d'avance
Claus T. 8 years ago
Thanks
Claus
Robert Pflumm 8 years ago
I'm very interested in the new code because I also want to build this project soon. How can I get it?
Thank you and best regards,
Robert
p_michele 8 years ago
I´ve build this project and I would like to get you code .
Thanks
Peter
Ezio D'Andrea 8 years ago
I think you can post here as attachment, if not I will give you my mail.
Thanks in advance, regards
Peter
sergios100 8 years ago
I build up your project and downloaded the software. Everything seems to work fine, except the one-hour-Trend. On the top left corner I can read in big Numbers the actual pressure, at the moment a value of 1017hPa in my case, which is almost constant (atmospheric pressure does normally not change very quickly). Right to it in smaller letters the one hour trend is displayed (Pa/h) and this value is showing every 5s an unrealistic and massively changing value, like:
-63
-77
-72
-60
...
I checked on the microSD Card, a File called "test15.txt" has been made which is growing in size (as does the bar on the screen).
I have to say, that I just build the project and it has not yet been running for 48h so far, but for more than 3h now.
On your pictures shown in the printed elektor magazine, I also could see that your graph is fairly straight, but the one hour trend is showing (+)17hPa/h.
Have you any idea where this can come from and how to adjust the sketch to prevent this?
Perhaps other readers who have likewise built up this project can report similar behavior?
Any hint is highly appreciated!
Cheers
Sergio
sergios100 8 years ago
There you go, you are perfectly right! Sorry my fault!
I slightly adjusted the software, so if there is no LED or Buzzer installed (as in my case) to notify the mariner of a rising storm, say if the barograph is mounted in a building, where no audible storm alert is needed, my version of the software will show in this case the words “STORM!” on a red Background on the top center of the Display just above where the oneHourTrend is plotted.
The rest of your fine software remaind untouched, so LED and buzzer can work to gether with the "on screen" alert.
Here is the code, is somebody is interessted:
Cheers
Sergio
Daniel.Coppens 8 years ago
congratulations, nice to see that you made the project and that it is working.
It is a while since I wrote the sketch but I remember that the
change per hour is in Pa and not in hPa.
For this reason the trend values changes with higher values.
A change of 140 hPa/h would be impossible. The pressure would then change over the total range within one hour.
Best regards,
Daniel
Nigel Mercier 8 years ago
I'm a little concerned about the BMP180 being used at 5V, it's a 1.8V to 3.6V device. See https://www.sparkfun.com/products/11824
Note also that the 12V supply on a boat can be around 14.6V, so a 5V power board is not "optional".
Can someone confirm that temperature compensation of the pressure is implemented?
Analphabeet 9 years ago
Hi Daniël,
I have been reading your cotribution about adding 3000 for the pressure, but adding to ???. I have missed the earlyer discussion. My problem is, how to adjust the pressure in the Barograph-skript.
With kind regards,
Wim.
Claus T. 8 years ago
I build the barograph and after 48 hourss I see the graph.
We have a rising pressure above 1035 hPa, now 1040 hPa, and the graph is a line at the top.
How can I change the range of the displayed values?
regards
Claus
Analphabeet 9 years ago
Daniel.Coppens 9 years ago
Analphabeet 9 years ago
Holger,
Perhaps you have to wait a few hours before the graph shows up?
The displayed value for the pressure has to fit within the grafic window, between 1053 and 980 hPa.
But perhaps this is not unkwown to you.
KInd regards.
Wim.
DE177147 9 years ago
Daniel.Coppens 9 years ago
DE177147 9 years ago
ClemensValens 9 years ago
Please note that the sketch that you can download from the main project page requires two libraries from Adafruit to compile. Download these libraries from GitHub and install them before launching the Arduino IDE (carefully read the instructions on the GitHub pages):
When you have these libraries installed properly, ie the Arduino IDE is able to find them, than the sketch above compiles without errors. (You may see a warning about high memory usage.)
Success!
Clemens
bera 9 years ago
I've used a 4" cheap TFT (ILI9488 , $8 on aliexpress.com) with an UNO for the Tambola game. The same technique can be used here for bigger display.
However the scaling ,sensors & other things need to be adjusted as per the original sketch of Daniel.
Daniel.Coppens 9 years ago