

Wind direction and speed instrument [120635-I]
General concept
General concept
If you look on this website you see several proposals for measuring and logging meteo data. Measuring temperature, moisture and airpressure is not to difficult nowadays using modern and cheap i2c compatable small electronic boards. But if I build one, I also like to know wind direction and speed. And hours of sunshine, but that will be a next seperate proposal (a LDR with a very cheap optical lens and colorfilter). So I designed, build and tested a prototype for wind direction and speed. I used a MBED uP for prototyping. Read on (at 'Interfacing') for suggestions of how to use the MBED as a master meteo logger or as a intelligent slave instrument.
Traditional way to measure wind direction and speed
The traditional (mechnical) way to measure wind direction and speed is to use a weathervane and weathermill. The position of the vane can be detected using a potmeter or a rotary decoder (maybe if you can make a special .wav file and burn it on a CD so that it has sectors on the CD with grey code, you can use the CD as a decoder) on its vertical axis. The speed can be measured by counting pulses or use a dynamo to measure current on a rotating axis. Especially for electronic engineers, building such a instrument requires mechanical skills and tools, which we often lack. Furthermore we have to take into account that the instrument is exposed to the weather (and that includes rain, hail, snow but also sand, dust or leaves or spiderswebs or bugs). So, is there a electronic alternative? I think there is; a instrument based on thermo-flow meters.
Thermo-flow
As a control engineer I was introduced ones with a thermoflow meter; to measure the amount of (polluted) air in a large pipeline somebody suggested using that kind of instrument. A small heater produces warmth which is measured a few millimeters after the heatsource with a accurate temperature sensor. So, if I use 3 temperaturesensors at a 120 degrees angle around the heatsource, I get a omnidirectional sensor (see Detailfoto-meetinstrument-1.jpg).
Hardware
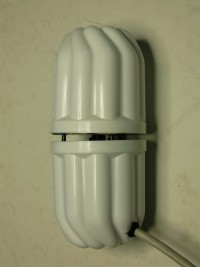
The heat is produced by a 2N2219A transistor (Conrad# 163139), placed in the middle of a wooden disc with a diameter of 57 millimeter. I choose 57 millimeters because it fitted in a cap of a foamcream aerosol can. Close around the transistor are 3 NTC's (Hygrosens CON-TS-NTC-204, Conrad# 502369). See Detailfoto-meetinstrument-2.jpg. After the transistor and NTC's were mounted on the disc, it is two times sprayed with black paint to protect it from pollution and corrosion. The main feature of the sensorhead is its 'roof' above the disc with the transistor en NTC resistors. This roof, consisting of a wooden disc covered with alu-folie reflects the uprising heat and keeps its within the slit where the transistor en NTC's are situated. This is the main mechanical feature (Detailfoto-meetinstrument-3.jpg)!
The 2N2219A transistor has a metal casing and a TO39 mount.. Feeding it with 3.3 Volt is a nuisance for electrical amplifying, but it produces a lot of heat! Using a 4.7K resistor from the base of the transistor to a digital output (high) let the transistor roughly consume 0.5 Watt, resulting in a 30 degrees Celsius rise to (any) ambient temperature. According to wind direction and speed the the 'heatcloud' changes shape which is measured by the NTC resistors. The NTC's are in series with a 180K ohm resistor and connected to 3 analog inputs of the MBED. No further amplifiying is done or necessary. See schematic.jpg. Practise results show that about 20% of the heat is sensed by the NTC's.
Software
See the softwarelisting in mbed-org-compiler-listing.pdf (in the .zip file).
Wind direction
After heating up, 12 measurements are taken at 5 second intervals of the NTC's. This is done via analog inputs. MBED converts 0 .. 3.3 V to 0.00 .. 1.00. The analog value increases with the increase in temperature. Then the values are subtracted from the maximum of the three analog values. These resulting values are vectors whose strengths point in the direction of the wind. All vectors are reduced to the x- and y-values of the circle (positive y-axis is pointing north). The needed trigoniometric values are sinus (30 degrees) and cosinus (30 degrees) and are fixed: 0.500 and 0.866. The reduction is done by multiplying with these values. The 12 x- and y-values are added up giving one v_x_s value and one v_y_s value. According to if the values are positive or negative, a quadrant (north to east, east to south, south to west, west to north) is selected. The 90 degree quardrant is subdivided with the arctangent function. See exampleNE.jpg for a grafical display. The resulting value is between 0 and 16, pointing a 22.5 degree sector on the circle. Sector 0 is north-north-east and counting up clockwise until 16, which is north-north-west. This value serves as a index to a textstring with discriptions of the winddirection (further reduced to 8 possibilities).
Wind speed
The first approach was to use the resulting vector calculated for the winddirection, but not using its angle but its strength (SQRT (v_x_s * v_x_s + v_y_s * v_y_s). For windspeeds 1 to 4 Beaufort (see beaufort.jpg for an explanation of the Beaufort scale) that worked allright, but than something strange happened for windspeeds of Beaufort 5 and higher. The original assumption was that the strength of the resulting vector increases with the windspeed. But from Beaufort 5 and higher the strength decreased again. A stronger wind blows so much heat out of the sensorhead that the difference between the NTC's diminishes. This is no problem for detecting the winddirection but for every strength there are two possible solutions of Beaufort values.
So an other approach was used; take all three NTC's measurements as one to measure the amount of heat in the sensorhead. Take 2 measurement series; one with a 'cold' sensor and one with a 'hot' sensor. The more heat is measured in the 'hot' period (compared to the 'cold' period) the more heat remains in the sensorhead, or is not blown away by the wind and so the weaker is the windspeed. Testing showed that this method works fine if the conversion of the measured value to Beaufort scale is done by a reciprocal function.
Test and calibration
The instrument is tested and calibrated in august 2012 at the frisian island Ameland. During the weeks windspeeds of Beaufort 1 to 7 were blowing on different days and from different directions.
Calibration of NTC's
The chosen NTC's can be exchanged without calibration according to Hygrosens. But because of slight differences in the position of the NTC's around the transistor and other mechanical toleration it is (probably) necessary to calibrate them with each other. The program provides three values (#define Corr_v1, Corr_v2, Corr_v3). To find the small values take the comment slashes (//) from lines 44 and 65. The program will print the measured analog values als voltages. If the sensorhead is put in a windless environment (indoors – don't run and puff around during the measurement) the values should be equal to a 0,01 Volt of each other. Start with the correction values at 0.000 and adjust according from the outcome.
Setting of B_numerator and B_offset
The difference (variable vv) between the 'cold' measurement (variable vk) and the 'hot' measurement (variable vh) is input for the conversion formula for the Beaufort strength (B_numerator / vv + B_offset). The value of B_numerator can be obtained by (again) do some measurements indoors – in a windless environment. Use program lines 44 and 65 to print the vk and vh variables and write down the last vk and vh values in a measurement cycle (5 minutes) and subtract them. Take some measurementcycli and choose an average. That will be B_numerator. Smart calculators recognise that the Beaufort scale then never becomes lower than 1, but hey, Beaufort 0 is a windspeed between 0 and 0.2 meters per second. You may set B_offset a little higher or lower according to your own assumption of what is the correct windspeed. Beware that by printing the Beaufort value as “%1.0f” the value is truncated. Setting the B_offset to +0.5 for example sets the value of Beaufort 2.6 to 3 instead of 2.
Next steps
PCB board
To make the instrument better reproducable it is a good idea to change the wooden disc with the 2N2219A and NTC's for a printed circuit board. A second small board soldered vertical under the PCB disc could hold a uP and some extra electronics. It may also be a good idea to make the diameter of the round PCB a little larger than the wooden prototype disc (57 millimeters). To bring wind turbulance to a minimum a rule of thumb is to make distance from the edge of the disc to the NTC as 5 times as large as the distance between the NTC and the the transistor. A piece of rainpipe with a diagonal of 80 millimeters would be ideal. For a proposal see montage.jpg. It may be interesting to test the instrument upside down. The heat is then locked from rising by the PCB (or melting it?).
Lowering energy consumption
The MBED I used for prototyping and to develop the program is of type NXPLPC1768. The disavantage is that is consumes a lot of power (60 to 120 mA). This is not good for a free standing instrument, probably running on battery power. So we have to replace it with a NXP LPC11U24 (1 to 60 mA). And it is also cheaper. Look on mbed.org for specs of the uP's. In the program we only exchange the wait () instructions by timed sleepinstructions. 99% of the measuring cycle is just waiting, so why waste energy then.
If you like to use an other type of uP, feel free to convert the program. What you need are 3 analog inputs, 1 digital output and a way to output the result. Your uP should be able to do the multiplication with 0.500 and 0.866 (or get around it by multiplying with something like 5000 and 8666 and subsequently dividing by 1000) and, more important, can perform the arctangent function!
To lengthen the time before the batteries are empty, it is a good idea to charge them using a small solar panel for outdoors use connected on the instrument housing (we want to put the instrument and housing free from obstacles and that makes it probably difficult to access to change batteries). Taking a 9V solar panel we can charge 4 AA batteries (5.2 Volt) with 5.6 Volt using a 5.6 Volt 500 mW zenerdiode with a 47 ohm resistor in series. This will charge the batteries with 72 mA. There will be no need for further charge and test electronics, because when the batteries get full there voltage will reach 5.6 Volt and the charging stops automatically.
Windtunnel
As said before the testing was done on the frisian island Ameland under different windconditions. The predicted windspeed was looked up from online weatherprediction websites. But actual, accurate windspeeds can change within minutes or even seconds. The reciprocal function seems to best fit to calculate the Beaufort strength. But before mass producing this kind of instrument it is a good idea to test it in a conditioned environment, especially in a windtunnel. But that is a bit costly for a prototype.
Interfacing
As stated before the place to mount this kind of instrument is to free airflow. In my case that will mean to climb on the roof of my house and fix it there somewhere. And that means also that to build a display on it, is useless. I think connecting a RFM12 radio transmitter / receiver to the MBED (see elektor jan. 2009) and send a direction and speed message at 868 Mhz every 5 or 30 minutes. An other small uP in my house with a RFM12 receives the message and displays it in a nice way. Because i2c communication is limited to 1 meter, that will also be no option. If you do want to use a cable, RS232 might be a option (15 meters, sorry - not enough for castle owners).
Other meteo data
Because the two i2c interfaces on the MBED are still unused it is quite easy to add a Hope RF HH10D (airhumidity) and a HP035 (airtemp. and pressure) sensor to the instrument (see elektor 575, september 2011). A sensor measuring hours of sunlight and rainmeter will complete the meteo instrument. I have allready started to design a simple hours of sunshine instrument.
Logging
If you are interested in logging, using a MBED might also be a good idea. The MBED has a inbuilt disc of 2 Mb (!) and functions to create, open, write, read and delete files on that disc. Connecting the MBED via its USB connection to a PC gives you access to this disc as if it were a USB stick. In a test I wrote a program reading HH10D and HP035 data and witing it to the disc in a .csv file format. OpenOffice could import this file with no problem at all.
Your help with the next steps is welcome.
Discussion (9 comments)
Lucky 11 years ago
Here in the Elektor lab I use this board instead of the mbed-module. I've ported the firmware to the AVR and doing some tests to calibrate this meter (thanks to Petrus for sending me his PCB design files!!).
I'm logging the calibration data to the PC via the USB-BOB, which is a bit more convenient than writing the values down from the LCD. First thing I noticed is that the delays for stabilisation of the temperature (from warm to cold v.v.) were a bit short, there was still some drift showing that the temperature and/or NTC's hadn't stabilised yet. Ten minutes delay (what I'm using now) may be too long, but the drift is gone.
During the 'cold' measurements all three NTC's show the same values, but during 'warm' one sensor shows a significant offset compared to the other two. Difference in characteristics of the NTC's or is this due to other factors, like radiation pattern of the transistor, or whatever? Still investigating.....
Lucky 11 years ago
NECV20 11 years ago
Lucky 11 years ago
NECV20 11 years ago
Donncha Butler 11 years ago
One possibility for calibration would be to wait for a calm (no wind) day, attach the device to a car and drive the car around. Calibration could be adjusted to match the car speedometer. I know little about aerodynamics but I presume you would need to mount the device high enough above the car to be out of the compressed airflow around the car body.
By rotating the device 120 and 240 degrees the calibration could be checked for each sensor to confirm even response regardless of wind direction.
petrus bitbyter 11 years ago
You can incorporate a P82B715 chip in the I2C-connection. With this buffer can inscrease the I2C cable length up to 50m. Use a four wire cable and you can power the unit on the roof from below. Much more reliable then batteries. Heating requires a lot of energy so even with solar cells you'll have to climb the roof quite often to recharge or replace the batteries.
As an alternative you can switch to a micro that supports ASYNC (RS232). But you'll need line drivers/receivers in that case as micro's outputs are no good in driving lines and inputs are too sensitive to be used as line receivers.
petrus bitbyter
NECV20 12 years ago
petrus bitbyter 11 years ago
Designing an 88mm PCB is (was) not that difficult.
Though some additions to the original schematic are made, it can be used as in the original state. The capacitor for decoupling the power supply can be omitted. The resistor in the emitter connection of the transistor - as I expect that circuit to be modified to make it reproducible - can be shorted if it is not needed. The NTCs and the transistor must be on the top of the PCB. For all other components SMDs are chosen and placed on the bottom. This way the disturbance of the airflow around the NTCs and the transistor is prevented.
I could not find the shrouded connector but Conrad sells pin headers that will fit. (739319 , 739135, 739107 or 739346). One drawback is the possibility to place the female (cable) connector wrong way. But the +3.3V is placed on a corner. When connected the wrong way that voltage is connected to nothing. The circuit will not function but no harm will be done. Another drawback is the mechanical connection of the connector to the board. Pull a little too hard and you will have the connector plus some copper traces loose. Adding some kind of glue may reduce that risk.
One other PCB is showed for only the transistor, the NTCs and the connector. Using this one you can place all other components on a separate PCB using TH types.
petrus bitbyter.
windppcmp.gif (18kb)
windppbrd.pdf (15kb)
windpmbrd.gif (16kb)
petrus bitbyter 12 years ago
NECV20 12 years ago
EN130719 11 years ago
This is a great idea and I have a number of questions/comments. Please accept the following not as any criticism but as (I hope) a useful contribution.
Heat source.
Are you using a TO-5/TO-39 can transistor to obtain a uniform cylindrical heat source?
Are you looking to dissipate a given power (watts) or are you looking to maintain a given temperature or looking to maintain a given differential in temp from ambient?
TO-5/TO-39 cans have quite a fast response in heating, is this needed during normal operation? Some cans have a thicker base (header) that take longer to heat up.
Temperature sensor.
Thermistors are a well tried measurement technique but they can be quite difficult to calibrate. How about using digital temperature sensors? They may have a response time issue since the packages may have a slower response time than thermistors. There are plenty about, some even with built-in calibration eeproms and they are not too expensive compared with accurate thermistors, and of course the A/D is done for you (up to 12 bits)
Accuracy
What do you feel is the overall accuracy for both wind speed and wind direction?
What could be ultimately achieved?
I noted comment about wind speeds greater than 5. Do you think that there could be an issue of turbulence within the 'slit'?
Could increasing the heat source watts at higher wind speeds help?
I note that you have quite a slow sample rate (12 samples at 1 per 5 Sec). Could that be increased so that measurements of 'gusting' could be made? I do not know about Ameland, but here in the UK at 200 metres up in the Pennines we get a lot of gusting, a steady wind is a luxury. With too low a sample rate you end up with the old issue of aliasing.
Keep up the good work
NECV20 12 years ago
Ap 11 years ago
Hello Necv20,
I wonder why a transistor was used for heating. A simple resistor would do the same, altough a transistor is maybe needed to switch the heating on and off..
So, why not using the sensors itself for heating.
If 0603 components are used, and the resistor and ntc are both (@t=25) 220Ohm, then by 3.3V power suply the dissipation in every ntc plus resistor is 25mW.
The total can be switched by a single transistor or even a oc output from a micro (it is only <25mA). It would be useful to have differential ad inputs for measuring the voltages from the ntc's
These can then be arranged on the outer border from a disc say 15mm diameter.
Start the measusrement (cold) and do a reading (gives the actual temperature ) and then after a waiting the next measurements (hot) for speed and direction.
Ap
Ap 12 years ago
NECV20 12 years ago
ClemensValens 12 years ago
Bobbylebob 11 years ago
Hello NECV20.
I carefully read your project, and i found your measurement technique is really clever !
However, I'm wondering about the polarisation of the heating transistor. As drawn in your schematics, it is directly connected between 3.3V rails, and used as a constant current source. As far as I understand the principle, the collector current relies on base current multiplied by hfe gain, which is a very 'volatile' variable !
According to 2N2219A datasheet, hfe is comprised between 35 and 300. The base current is set to around 550µA ((3.3-0.7)/4.7k), therefore your collector current is comprised between 19mA and 165mA, and dissipated power is between 60mW and 550mW. I'm sure it works on your prototype, but this has great risks of beeing non reproducible on other's boards, isn't it ?
Furthermore, hfe varies depending on transistor temperature. The 30°C temperature rise you expect could be far less on snowy days...
I guess your 3,3V supply is regulated, so a simple resistor would do the job better than a transistor. I agree that the transistor had the advantage of having its pins on the bottom, making the assembly easier than with a resistor... Maybe you could use resistive wire winded in a spring shape, with both ends on the same side...
NECV20 12 years ago
ClemensValens 11 years ago
Hello NECV20,
I am currently looking at reusing our USB Long-Term Weather Logger (http://www.elektor.com/100888) in conjunction with a pluviometer. We could add your wind meter too. That way we would end up with a pretty complete weather station capable of logging atmospheric pressure, temperature, humidity, rainfall, wind speed & wind direction.
What do you think?
Regards,
Clemens
NECV20 12 years ago
NECV20 11 years ago
Hello Wassy,
I saw you registered as a member for this proposal. Welcome
I like to ask you if are interested is some particular part of the project and if you are willing to add in the design of the 'next steps' I wrote about in the proposal?
Regards, NECV20